
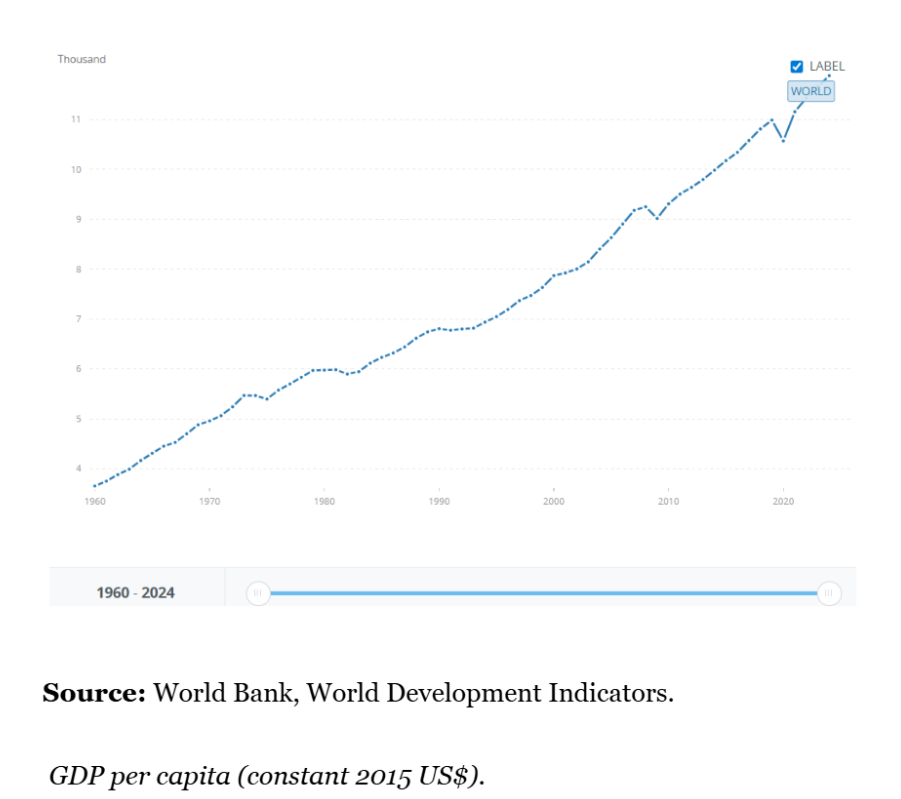
In 2023, global CO₂ emissions were 39,023.9 MtCO₂e, a staggering increase from 36,154.3 MtCO₂e in 2020. In the same year, climate catastrophes caused $380 billion worth of economic losses worldwide. Concurrently, statistics from World Bank reveal that world GDP per capita doubled between 1990 and 2016 and so did air pollution and environmental degradation. Here’s the question of the moment: How sustainable can it be for world GDP to keep growing as environmental breakdown accelerates at the same time?
The explanation is the nature of GDP as an economic measure. As economist Simon Kuznets described it, GDP was conceived as a tool to measure market activity — and only secondarily used as an approximation of economic welfare. GDP measures the monetary value of final goods and services (bought by the final user), produced in a country in a given period of time. In that sense, GDP was never conceived to measure social welfare or environmental well-being. Notably, it does not account for natural capital depletion or the environmental costs of economic production, such as pollution. As such, GDP growth global or domestic can rise with increasing environmental costs, promoting a sense of progress when underlying resilience is on the wane.
More significantly, GDP does not account for market failures such as incomplete information or pollution spillovers. Deployment of slanted measures such as GDP may create an illusion of growth as the well-being measured for a nation may increase while scarcity of natural resources worsens. It is therefore necessary that, in the measurement of life satisfaction, social well-being, and environmental health, measures such as the Genuine Progress Indicator (GPI) be included since it measures environmental benefits and costs better.
The imperative becomes clearer if we bear in mind that we already live on inherited assets from the future. The fact that our economy is unsustainable and our production and actions continue to feed emissions only serves to highlight this fact. On the UNFCCC response to these challenges, the aspiration of achieving net-zero emissions by 2050 has been set in terms of not surpassing a temperature increase of 1.5 °C. To combat the growth of anthropogenic emissions mainly from the burning of fossil fuels carbon measures have emerged to define the emissions created by each player in scopes and activities.
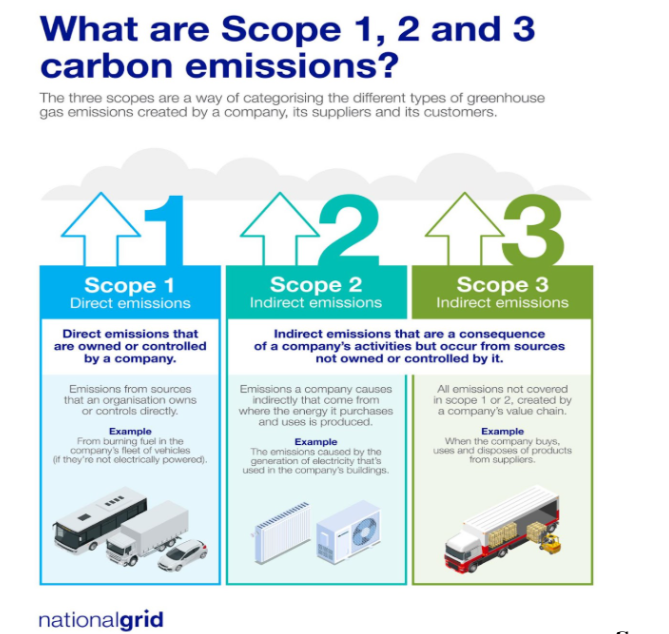
To enable climate accountability, emissions are typically reported in three scopes. Scope 1 encompasses all direct GHG emissions from sources owned or controlled by the firm, while Scope 2 is indirect emissions from the generation of purchased electricity consumed by the firm. Scope 3 is all other indirect emissions and is typically a voluntary reporting category that includes emissions that occur as a consequence of a company’s operation within its value chain. Companies still get to decide which scopes they report the majority only report Scopes 1 and 2. As a result, Scope 3, which is typically the largest part of total emissions, gets excluded. This exclusion represents a profound blind spot, since accounting for Scopes 1 and 2 only methodically underestimates both the real climate footprint and the size of transition risk.
Furthermore, the difference between absolute and intensity measures is significant when gauging climate performance. Absolute measures count overall emissions in tons of CO₂-equivalent, giving a simple picture of a company’s true footprint but potentially rewarding small firms simply because they produce less overall. Intensity measures measure emissions as a function of revenue or output, capturing efficiency but sometimes hiding growing overall emissions. That means the climate profile of a company looks more or less positive depending on which metric one applies. Metric selection is thus crucial to make decarbonization progress transparent and the use of complementary metrics can force latent transition risk to emerge and resolve.
As a result, even when a company’s carbon footprint is low by the standards it adopts, it may not follow that it has low climate risk. There are many other risks that must be included in measurement of the green performance of a company physical risks like flooding and drought affecting factories and supply chains. There are also policy and transition risks in the shape of regulatory bans, stricter emissions limits, and carbon price volatility. But the overwhelming majority of corporate reporting remains founded on incomplete and outdated data, offering an insufficient representation of the true scale of these risks. The IPCC warns that even a 0.1°C increase in global temperatures would significantly enhance climate dangers, and that maintaining emissions at around 450 ppm CO₂e would still be likely to result in a 2–2.4°C rise in temperatures. This also underlines the need for new and more integrated indicators, along with emissions reduction targets, mitigation scenarios, and early action.
In short, the reality is that while GDP registers economic progress, it is not possible to quantify society’s well-being and the state of our world and ecosystems. Additional indicators and measurements need to be devised, as carbon footprints will not be enough to gauge the well-being of our climate. Presently, decisions are too often being made on biased economic and environmental statistics, presenting a false view of development while the environment around us deteriorates.
A comprehensive strategy one that couples climate risk indicators, natural capital and social well-being with economic prosperity could shift the framing and provide a more equitable perspective. Only when prosperity is within the constraints of planetary boundaries can our societies and economies thrive in the long run.